How to view and edit JavaScript in your browser's developer tools
In your browser’s developer tools, HTML and CSS are relatively easy to find and adjust. Today, we’re going to look at how you can do the same thing with JavaScript.
Let’s dig in!
A sample script
We’ll be using a small sample script for today’s lesson. The code is available on GitHub.
It includes an HTML file with a button element.
<p>
	<button>Activate Me</button>
</p>
Inside the script itself, there are a few event listeners set on the button.
When it’s clicked, a message is logged to the console. On hover, we’re scaling the button up to twice it’s normal size. When the mouse leaves, we scale it back down to normal size.
(This is better done with CSS, but this is just for teaching purposes.)
// Get the button
let btn = document.querySelector('button');

// Do some events
btn.addEventListener('click', function () {
	console.log('Activated');
});

btn.addEventListener('mouseenter', function () {
	btn.style.transform = 'scale(2)';
});

btn.addEventListener('mouseleave', function () {
	btn.style.transform = '';
});
In Chromium browsers
In Chromium browsers like MS Edge and Google Chrome, right click on the button element and select “Inspect Element” to pull up the Inspector in dev tools.
By default, the CSS Styles are shown.
But one of the menu options is Event Listeners. Click on it to view all of the listeners set on that event (including ones covered by event delegation).
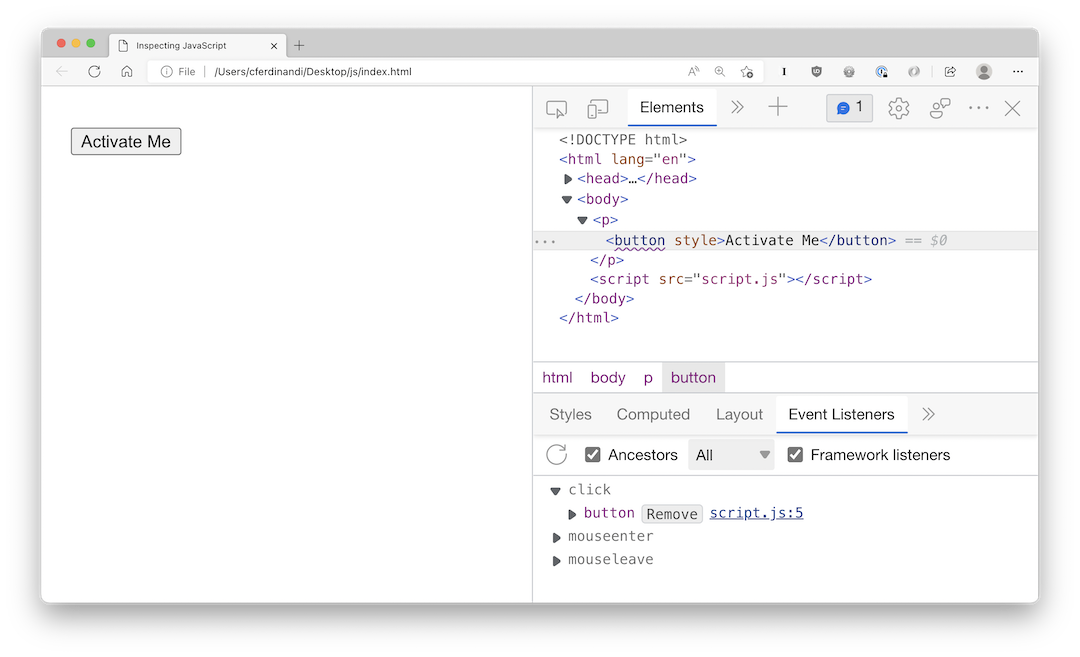
Each event can be expanded to show a list of affected elements.
You can click the “Remove” button to remove the event listener from that element, or click the link to the source code to view the full script in context.
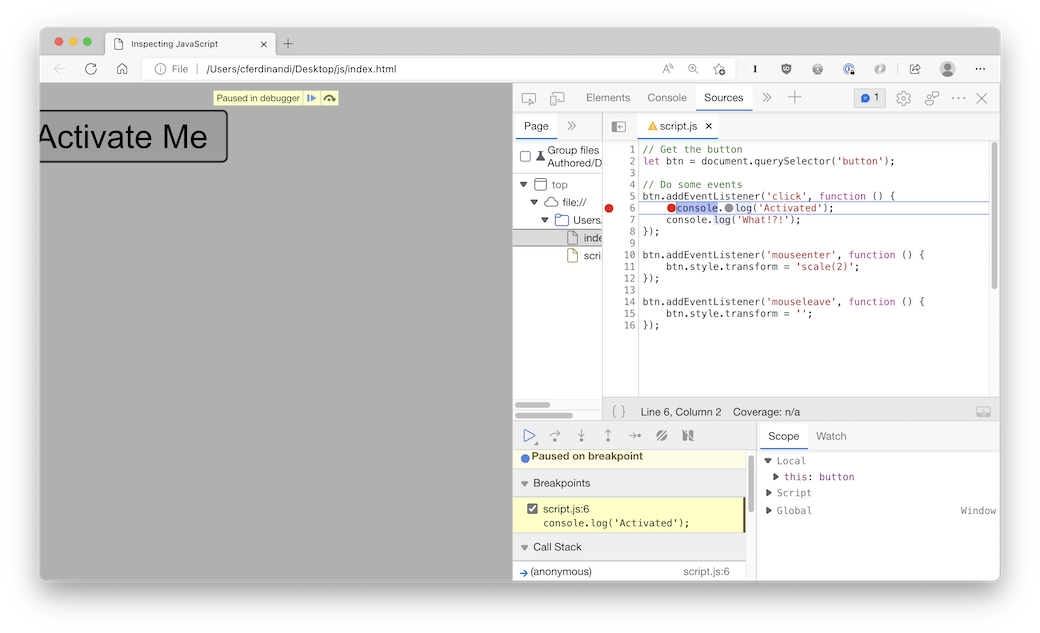
If the script is an external file (as in, not inline JS), you can actually modify it and save your changes for the current session.
Click a line number next to the code, or right click and select “Add breakpoint,” to add a breakpoint to the code. This will pause code execution on that line until you click the play button to continue.
This can be useful for debugging code.
In Firefox
In Firefox, right click on the button element and select “Inspect Element” to pull up the Inspector in dev tools.
If the element is affected by any JavaScript events, you’ll see an “Event” button next to it. Click that button to bring up a tooltip window with a list of events. Each event can be expanded to show its source code.
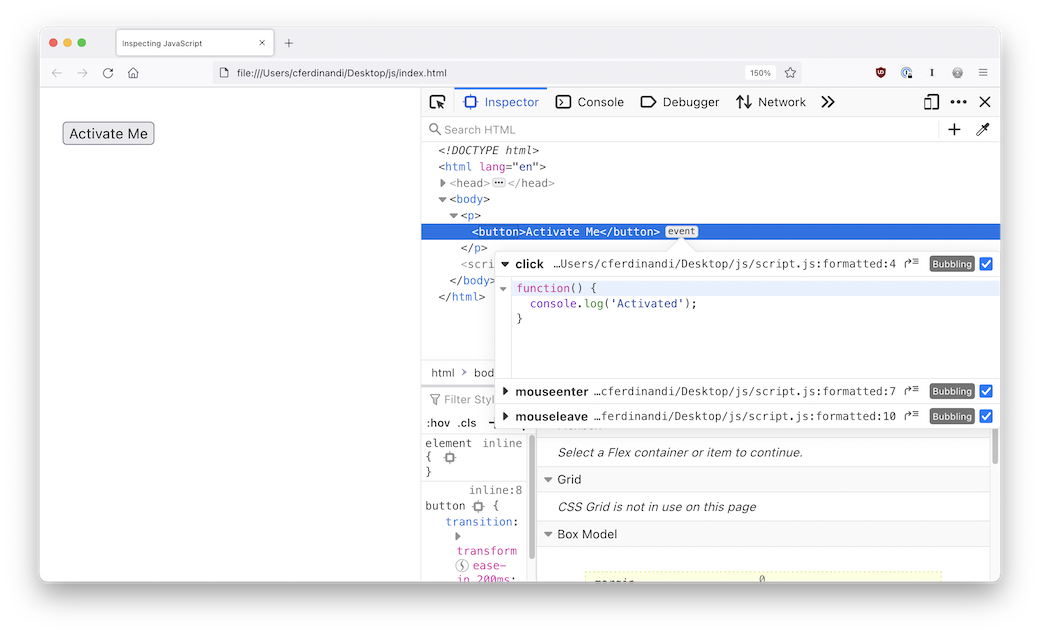
Deselecting the checkbox next to the event will remove the event from the element. You can click the button that looks like a curved arrow next to a list to view the source code.
Click a line number next to the code, or right click and select “Add breakpoint,” to add a breakpoint to the code. This will pause code execution on that line until you click the play button to continue.
You cannot edit the script in the Source panel in Firefox like you can with Chromium browsers.