How to debug event listeners with your browser's developer tools
When you’re working with a UI, you may sometimes need to figure out what event (and subsequent callback function) is being triggered by an interaction with an element.
For example, on the homepage for my site, there’s a newsletter signup form. When you click the Get Daily Developer Tips button, what happens?
Today, I’m going to show you how to use your browser’s developer tools to debug event listeners. Let’s dig in!
Right click > inspect element
On the page, right-click the element you want to debug event listeners for, then click Inspect Element.
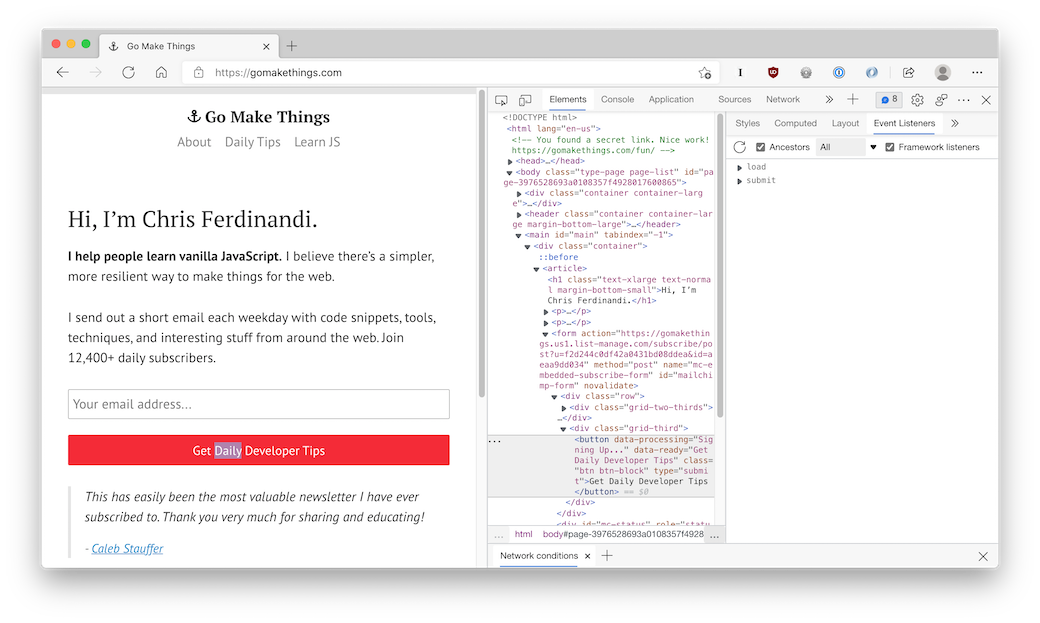
In chromium-based browsers like MS Edge and Google Chrome, click the Event Listeners tab in Developer Tools. There, you’ll see a list of all of the events being listened to on that element.
If you expand the event, you can see what element they’re attached to (because of event delegation), and click a link to open up the actual event listener itself in the JavaScript.
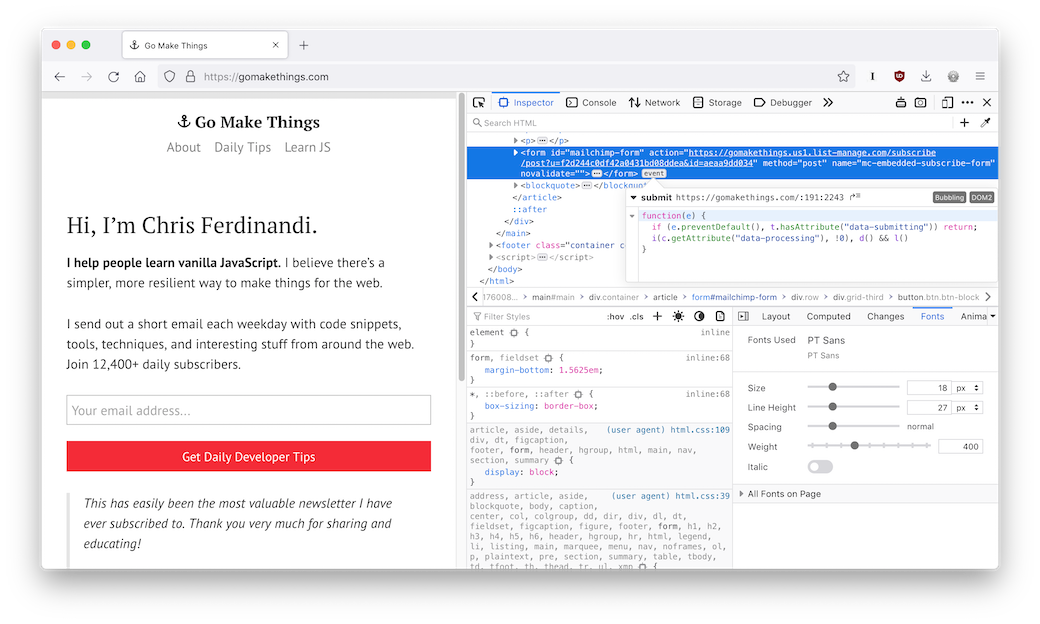
In Firefox, events are only surfaced on the element they’re attached to. It doesn’t account for event delegation.
Using my newsletter form as an example, the button element has no events attached to it, but the parent form has a submit event listener. Clicking on the event chicklet next to the form element in the Inspect Element tab reveals the event details, including the callback function that’s run in response.
Other practical uses
In chromium’s developer tools, you can also remove attached events.
This is particularly useful when forms prevent you from pasting in you passwords, account numbers, and such, which makes using a password manager much more difficult.